How to use Options Profit Calculator
Options Profit Calculator
Build an options position from the prices you type and see its profit or loss at expiry and before it, with max profit, max loss, break-evens, the Greeks and a chance of profit estimate.
Bought Options Profit Calculator? Sign in with the email you bought it with to download the latest version or ask me a question.
On this page
A calculator for your own numbers, not financial advice. You type the underlying price, the premiums and the volatility. The app doesn’t fetch market data, connect to a broker or place orders.
Install
Options Profit Calculator requires macOS 14 Sonoma or later, on Apple silicon or Intel. Download the ZIP from the order page or your Creem receipt. Unzip it and move the app to Applications.
The app checks for updates once a day. When a new version is ready, click Install and Relaunch. To check anytime, choose Options Profit Calculator → Check for Updates….
The Market card
Every position starts with the Market card on the left:
- Underlying price: the price of the stock or ETF now.
- Today: the date the estimates start from. Reset sets it back to today. Change it to look at a position as it was on an earlier date.
- Risk-free rate % and Dividend yield %: used by the model for the estimates before expiry. The dividend is a continuous yield.
- One implied volatility for all legs: when it’s on, one Implied volatility % field applies to every leg. Turn it off to type an IV for each leg.
Without an implied volatility, the app still shows the payoff at expiry, max profit, max loss and break-evens. It hides the estimate, the Greeks and the chance of profit until you type one.
Build a position
A new window (Command-N) shows Build a position on the right, with 14 strategy cards: long call, short call, long put, short put, covered call, cash-secured put, bull call spread, bear call spread, bull put spread, bear put spread, iron condor, iron butterfly, long straddle and long strangle. Each card has a small drawing of its payoff at expiry.
Set Expiry for the new legs first, then click a card. The strikes are placed around the underlying price, and the premiums are filled in from the model as a starting point. Replace them with the prices your broker quotes.
To type the legs yourself, click Add Leg (Shift-Command-L). It adds a call at the nearest strike. The Strategy menu above the legs replaces them with a template after asking, and Edit › Undo brings the old legs back.
Calendar and diagonal spreads aren’t in this version: every option leg in a position shares one expiry.
Leg cards
Each leg has:
- A checkbox to include or leave out the leg, and buttons to duplicate and remove it.
- Buy or Sell, and Call, Put or Shares.
- Contracts, Strike and Premium for an option. Shares and Price per share for shares.
- Expires, the expiry date.
- Per-leg IV % when the shared volatility is off.
The line next to the expiry says “Paid per share” or “Received per share, × 100 per contract”. Premiums are per share, as brokers quote them, and every contract is 100 shares. Amounts are shown in dollars.
The Notes field under the legs is saved with the position.
Read the analysis
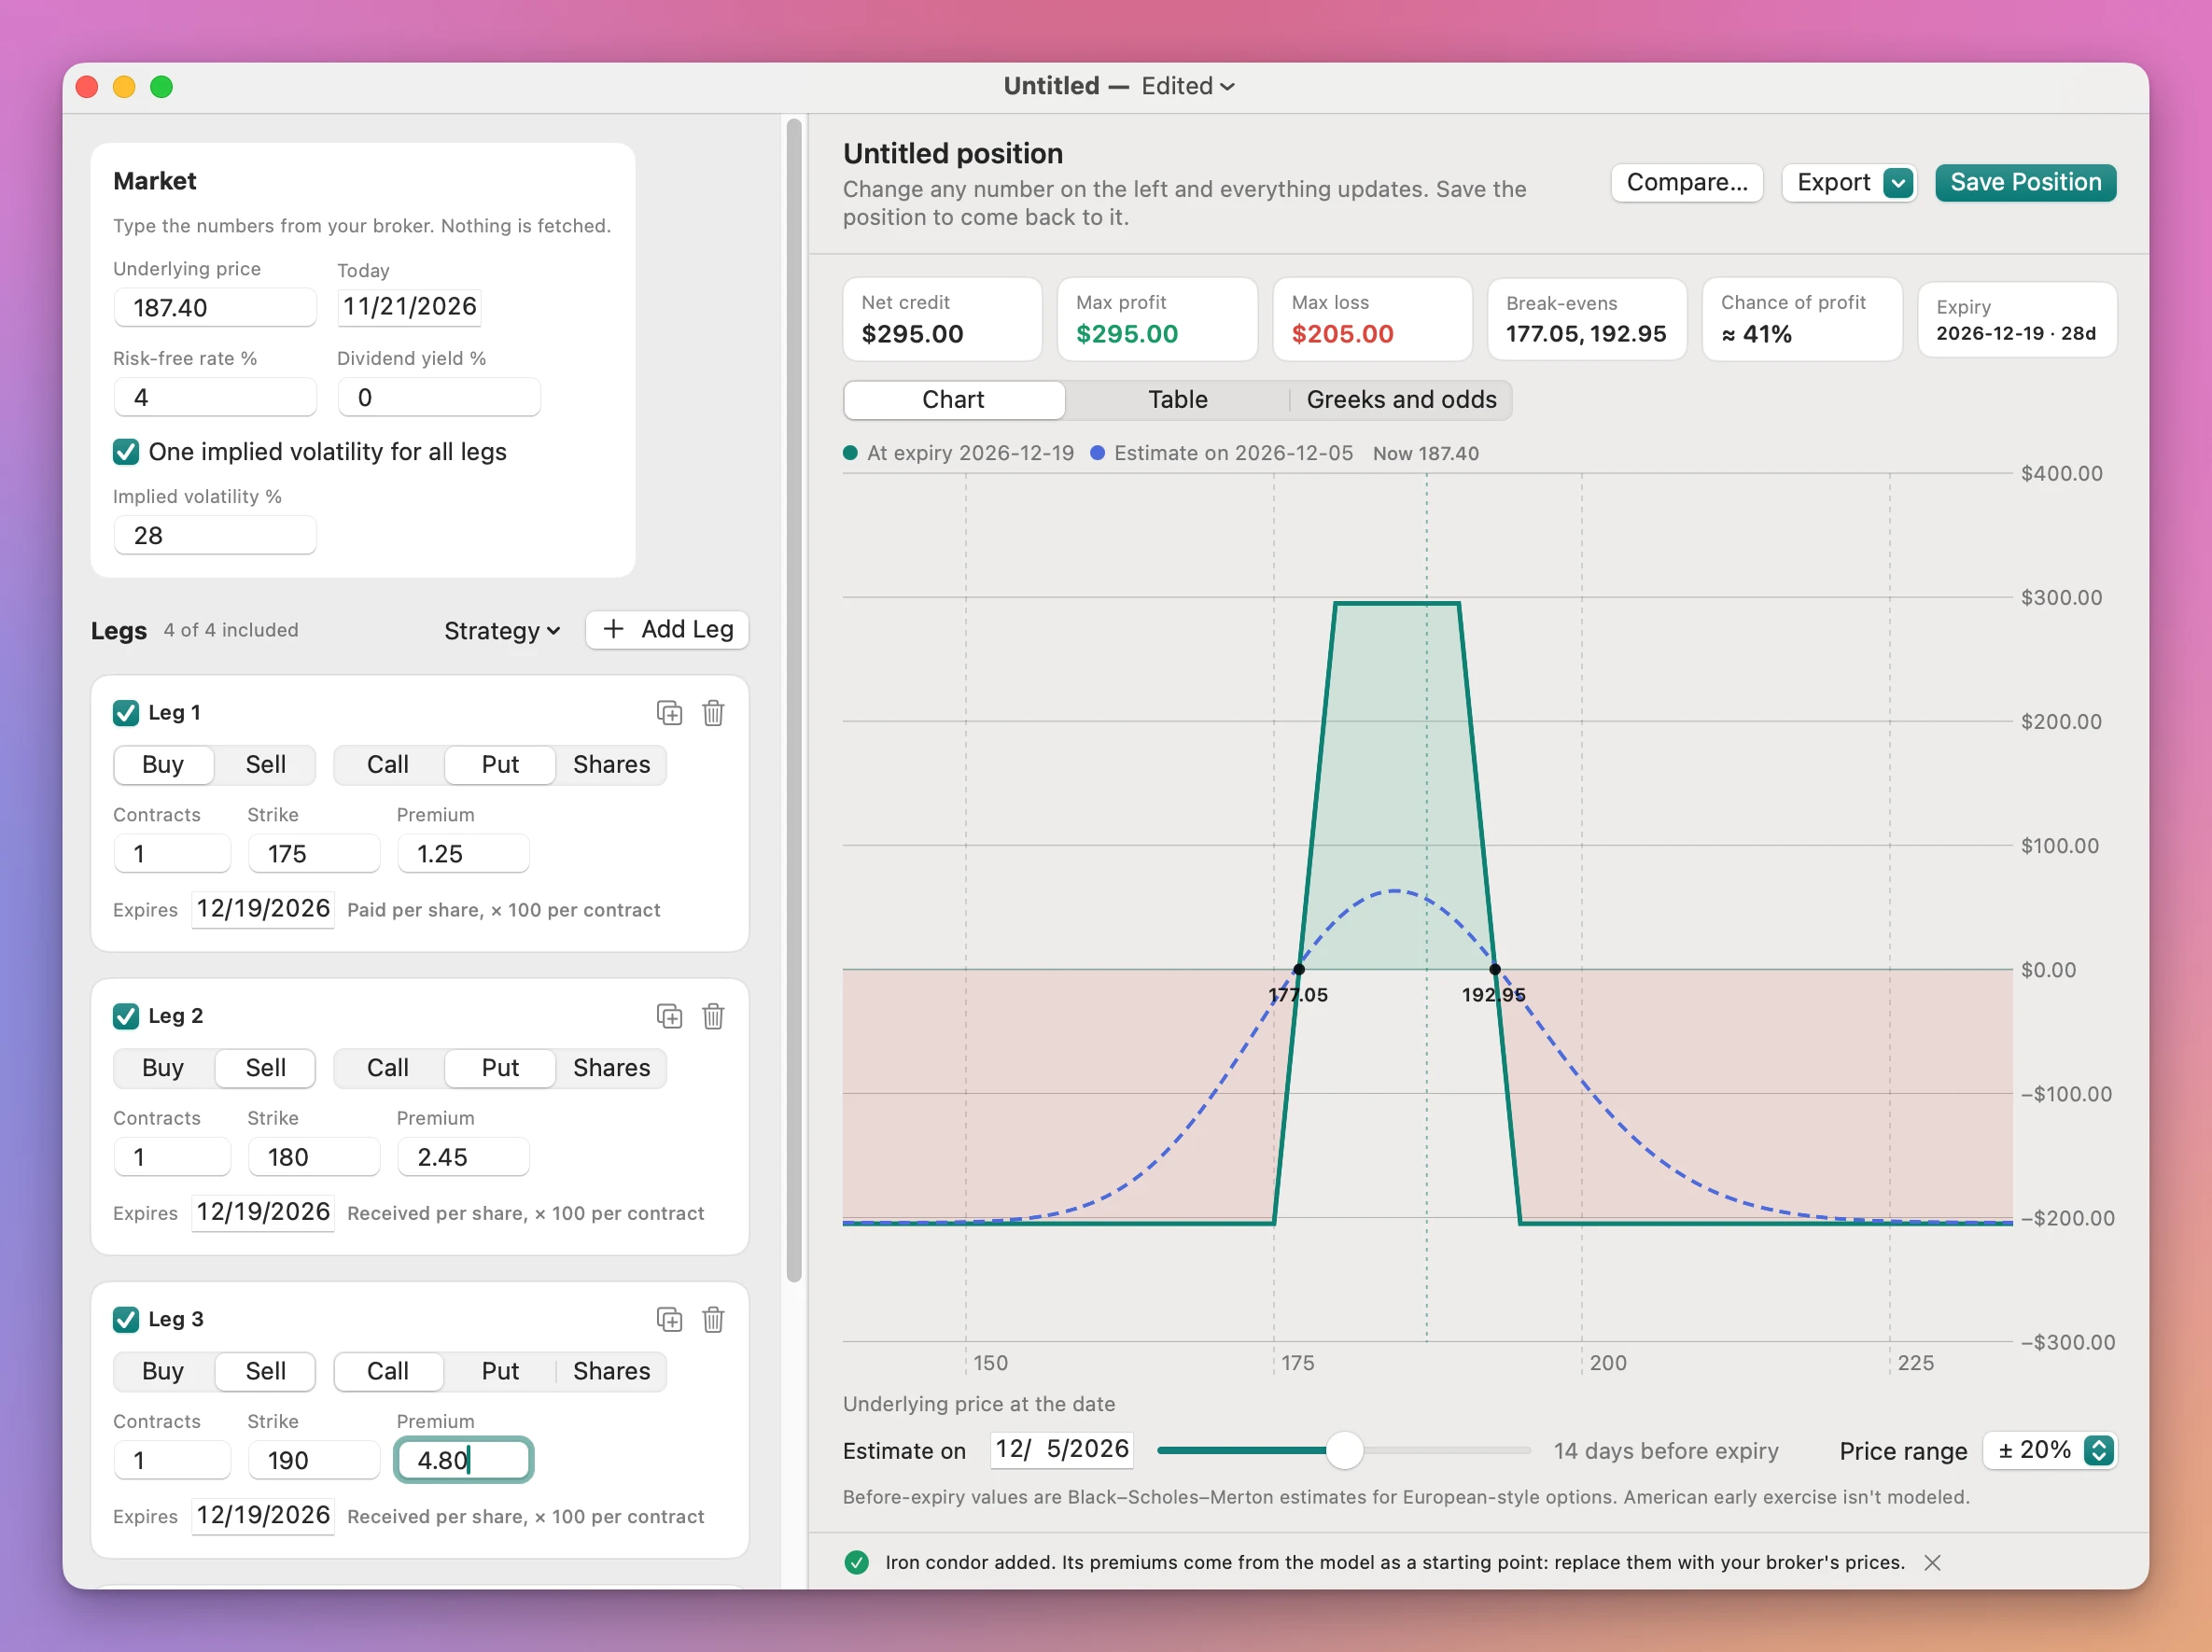
The header shows the position name, Compare…, the Export menu and Save Position. Under it, the pills:
- Net debit or Net credit: what the position costs or brings in.
- Max profit and Max loss at expiry. Max loss reads “Unlimited” when more calls (or shares) are sold than bought, and a red line says so.
- Break-evens at expiry.
- Chance of profit: the model’s estimate, or “Needs IV”.
- Expiry and the days left.
Chart
The solid line is the profit or loss at expiry, with profit shaded green and loss shaded red. The dashed line is the model’s estimate on the date in Estimate on, which you can also set with the slider. A dotted line marks the price now, and dots mark the break-evens. Hover over the chart to read both values at any price. Price range sets how far the chart goes from the price now: ± 10%, 20%, 35%, 50% or 80%.
Table
Profit or loss by underlying price (rows) and date (columns). The rows are round price steps plus the price now, in bold, and the break-evens. The columns are today, three dates in between, the date you picked and expiry. The expiry column is exact, the others are model estimates.
Greeks and odds
The whole position’s Greeks at the price now, for all contracts together:
- Delta, in shares: roughly what the position gains or loses per $1 rise in the price.
- Gamma: how much delta changes per $1 move.
- Theta, per day: what one calendar day passing does to the value.
- Vega, per IV point: what a 1-point rise in implied volatility does.
- Rho, per rate point: what a 1-point rise in the risk-free rate does.
- Chance of profit at expiry, with the volatility it used.
For a cash-secured put, the tab also shows the cash to set aside.
The model
- Values before expiry are Black–Scholes–Merton estimates for European-style options, with a continuous dividend yield. American early exercise isn’t modeled, and there’s no volatility skew.
- The payoff at expiry is exact. An option is worth its intrinsic value on its expiry date.
- Time is counted in calendar days divided by 365.
- Chance of profit assumes the price at expiry follows a lognormal distribution with drift r − q and one volatility. When legs have different volatilities, it uses their average. Real prices jump and have fatter tails.
When something needs fixing
If an included leg can’t be read, the right side says “The chart needs a few fixes” and lists each problem as a sentence, and the leg card turns red with the same sentence. For example:
- A negative premium: type the price per share you paid, and let Buy or Sell set which way the money goes.
- An expiry before Today: pick a later expiry, or change Today if you’re looking back.
- Legs with different expiries: this version needs one expiry per position.
Save, compare and export
Save Position (Command-S) saves a .optionsposition file. Double-click it to open it again. File has Duplicate, Rename…, Revert To and Open Recent, as in other Mac apps.
Compare… (Shift-Command-K, or Position › Compare with Another Position…) asks for another saved position and shows both expiry lines on one chart, with a table of legs, underlying and expiry, net debit or credit, max profit, max loss, break-evens, chance of profit, delta, theta and vega. To compare a variation, use File › Duplicate, change the copy, save it, then compare.
The Export menu has:
- Chart as PNG…: a 2400×1440 image on a light background, with the legs, the numbers and the model note. It’s also Position › Export Chart as PNG… (Command-E).
- Table as CSV…: the profit table. It’s also Position › Export Table as CSV… (Shift-Command-E).
A line at the bottom of the window confirms the export, with Show in Finder.
Your data
Positions are only the files you save. The app uses the internet only to check for and download updates. It doesn’t account for commissions, fees or assignment.
Options Profit Calculator is $19, a one-time purchase.